The SME (Rheonics transmitter) can be configured in many parameters through the RCP (Rheonics Control Panel). On Calculation tab, after enabling the Expert Mode, users can configure useful calculated parameters, such as temperature-compensated viscosity, density, and concentration values of interest.
See how to obtain and fill the data in RCP for each calculation in the respective support article on the Measurements folder.
SME has a good amount of communication protocols available for the user to handle the measured and calculated data, these are explained below. By default, for some protocols, the compensated values aren’t shown and the user needs to configure the RCP software correctly.
1. Through display - only for SME-TRDOn Calculation Tab, after including the inputs for the calculation, select the line where LCD will show the value and click Load Configuration.
 Figure 1: Show calculated value on SME-TRD display.
Changes can be verified on the “Communication” Tab.
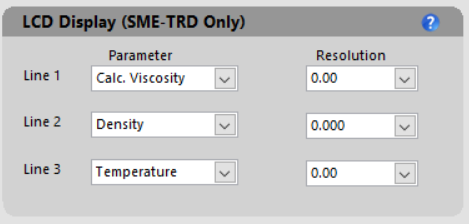 Figure 2. The communication tab has the loaded parameter.
2. Analog outputsIn Calculation tab select analog channel to send data.
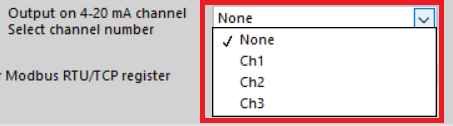 Figure 3. Selecting analog output channel
This can be verified in the “Service” Tab, 4-20mA Settings box.
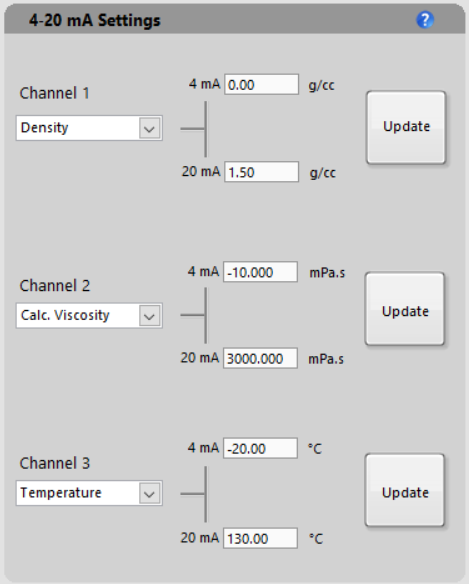 Figure 4. Calculated value loaded into the analog signal from the SME.
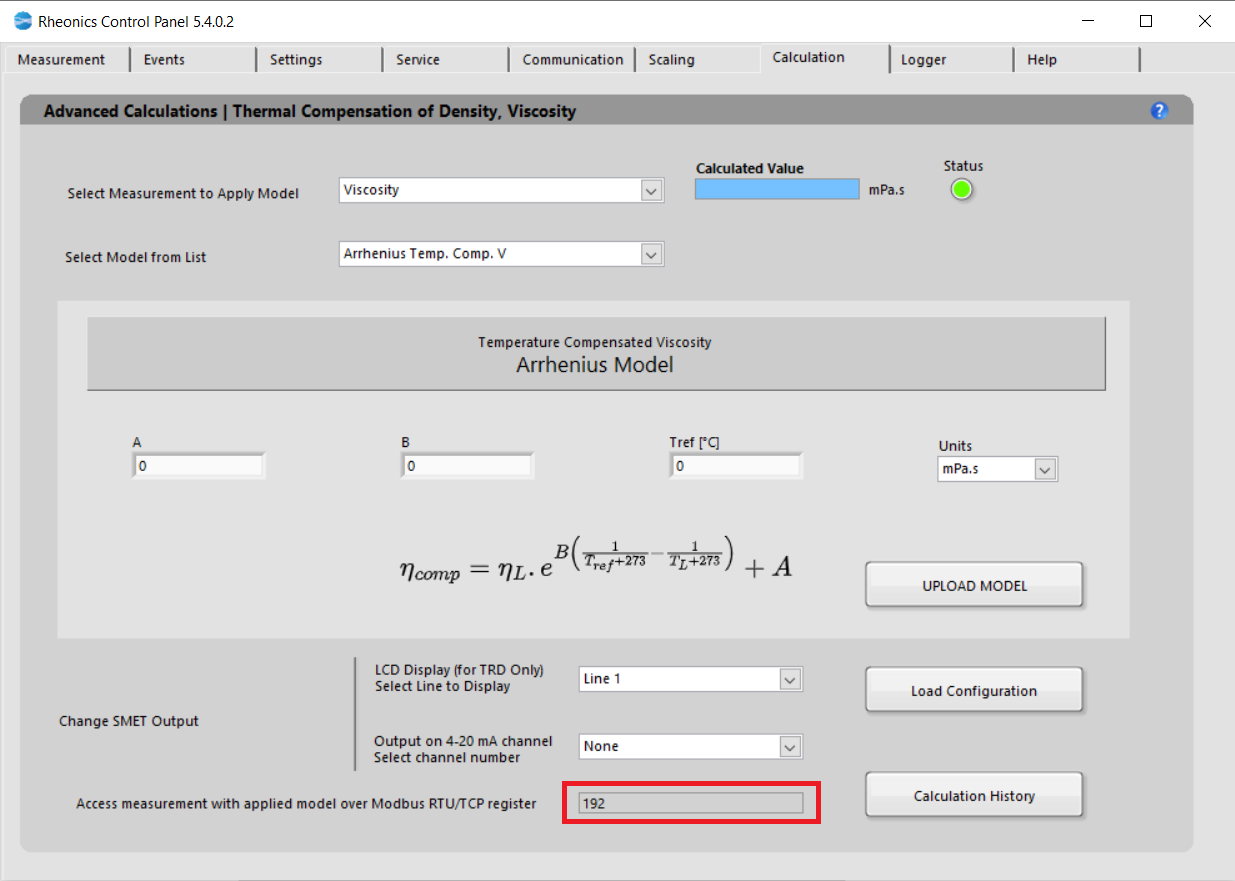
3. Modbus TCP/IP registerEach measurement can always be accessed at their register address that is displayed at the bottom on Calculation tab. Next table indicates the register for each of the calculated parameters.
Measurement | Modbus RTU/TCP register |
Calculated viscosity | 192 |
| Calculated density | 200 |
| Concentration | 208 |
The “Calculation History” button allows you to open a file where the last uploaded models and coefficients for these models are stored. This is for user reference.
4. Profinet and Ethernet/IP parametersOn Profinet and Ethernet/IP, the addresses are the followings. For more information, please visit the next page:
 All rheonics inline viscometers and density meters support EthernetIP for connection
Measurement | Profinet and Ethernet/IP parameter |
Calculated viscosity | 19 |
| Calculated density | 20 |
| Concentration | 21 |
5. On "Measurement" Tab from RCPFollow next steps to display the temperature compensated viscosity on the “Measurement” Tab from the RCP.
5.1. Go to the "Settings" tab and on the "Graph Settings" section open the Viscosity drop-down menu and select "Calc. Visc" for calculated viscosity. For calculated density or concentration use the Density drop-down menu.
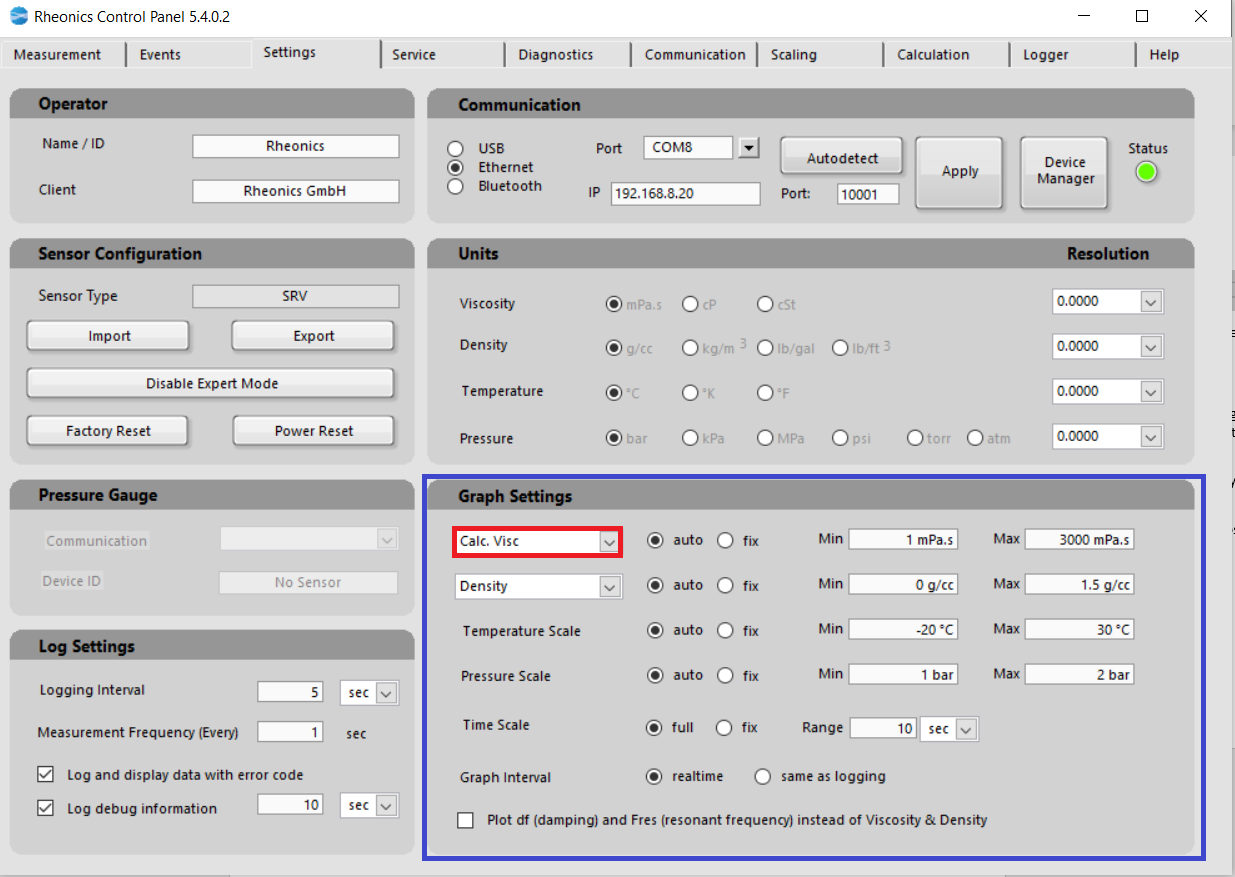 Figure 6: RCP setup for special calculation models.
5.2. With this selection, the "Measurement" tab is updated with the Calculated Parameter instead of showing the standard parameter.
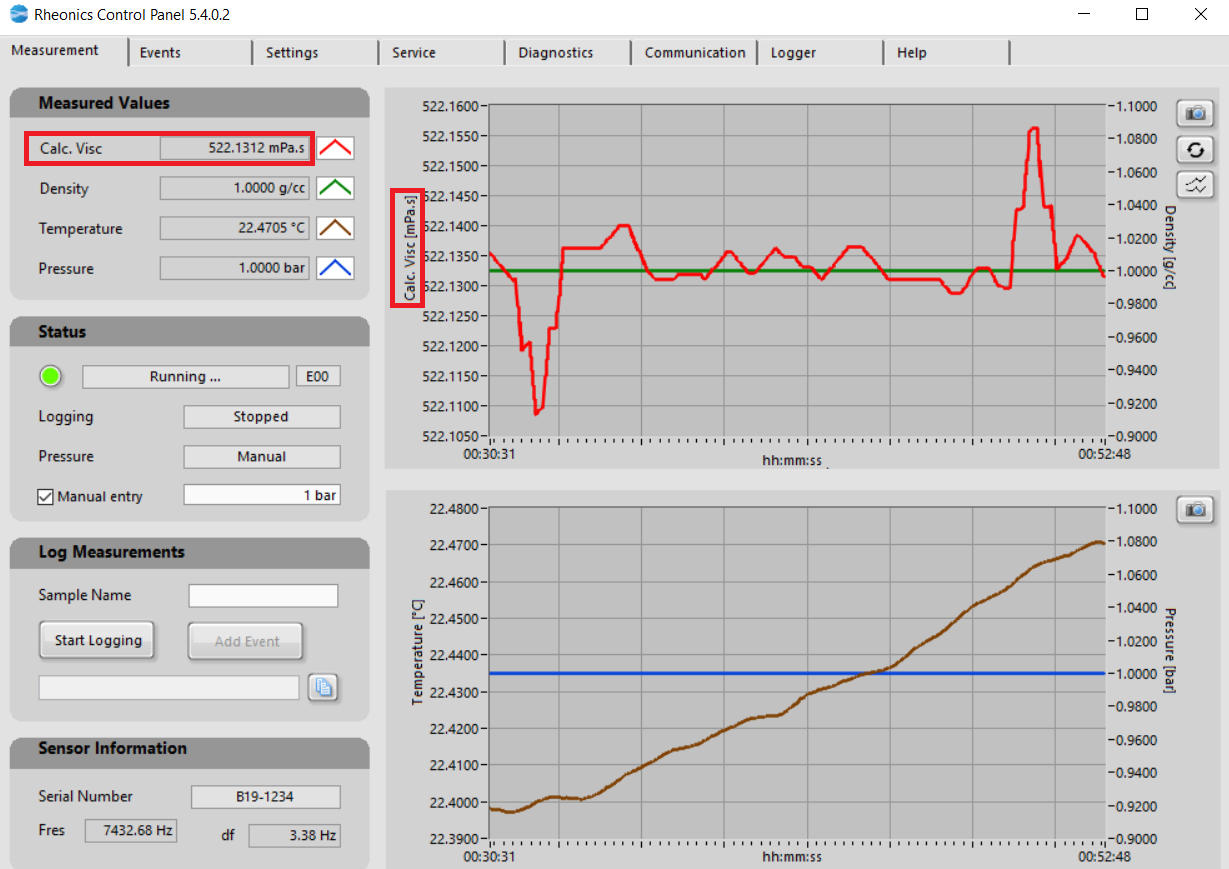 Figure 7: Special calculation model loaded into “Measurement” tab.
6. Accessing both raw and compensated values through onboard loggerMeasurement and diagnostics data is stored on the card giving access to the last 1 year of data. The onboard data logger can be configured to store data for even longer periods of time and at an adjustable duty cycle.
Data can be saved by following the next steps:
6.1. Onboard logger can be accessed from the "Logger" tab, select the last data for the most recent logging and click the download button.
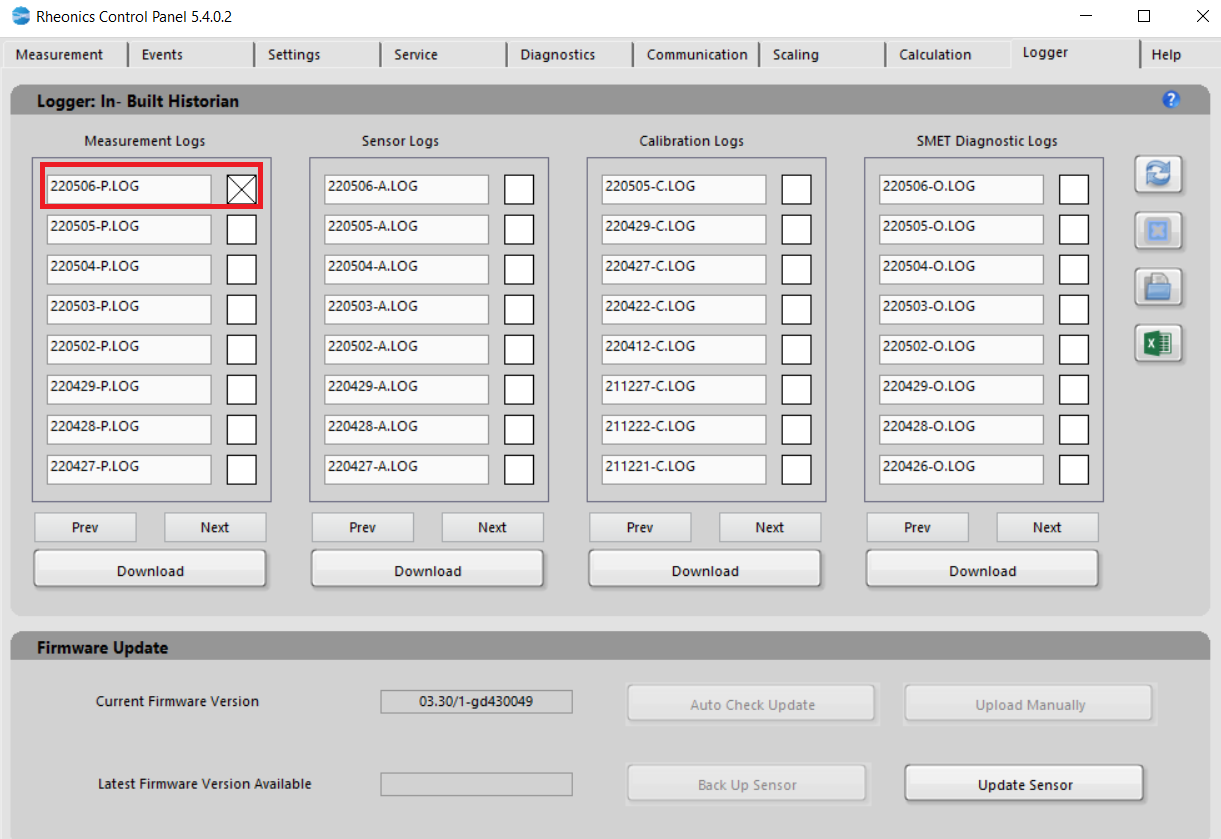 Figure 8: Onboard Historian
6.2. Click on the “Excel” button, so the save data is directly loaded into an excel file.
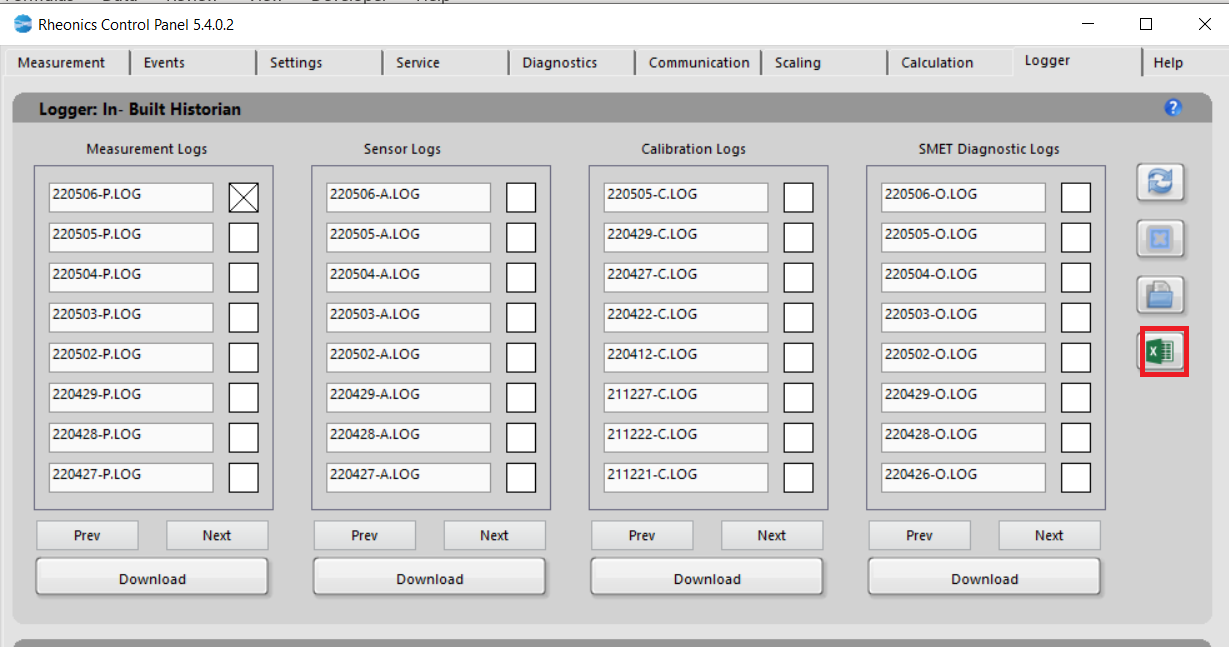 Figure 9: Exporting data with the “Excel” button.
6.3. Excel file is going to display all relevant data from each parameter provided.
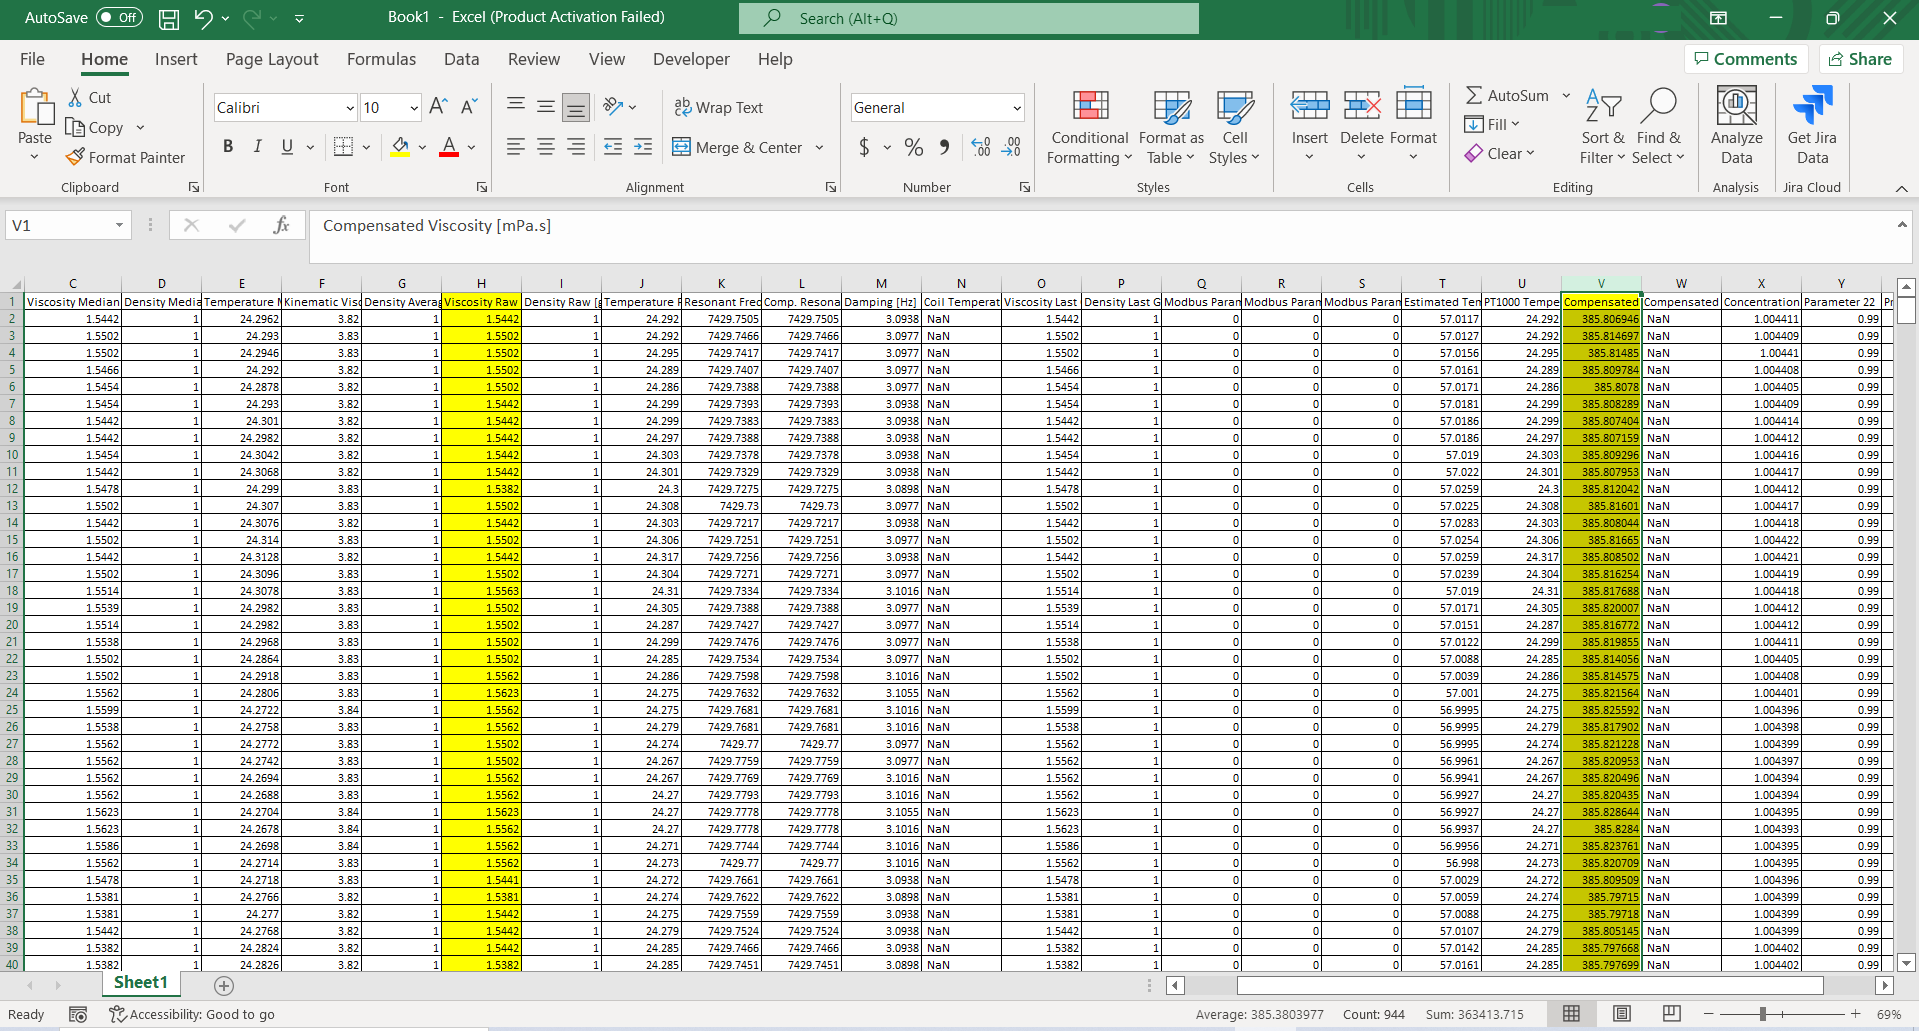 Figure 10: How the data looks in Excel.
Excel table will show parameters in order. Raw and calculated values order are the following:
| Parameter number | Raw | Calculated |
| Viscosity | 5 | 19 |
| Density | 6 | 20 |
| Concentration | - | 21 |
More detailed information about the onboard historian can be found at: Onboard data historian access on the rheonics inline density meters and viscometers
References[2]: https://support.rheonics.com/support/solutions/articles/81000383738-on-board-logger-historian-